With the advent of the big data era, data analysis and visualization have become an indispensable part of corporate decision-making and business development. In this context, Node-RED data visualization, as a new data visualization tool, is gradually gaining attention and favor from enterprises and developers. So, what is Node-RED data visualization? What are its advantages and application scenarios?

Node-RED is a process programming-based tool designed to simplify the integration of IoT devices. As a low-code programming tool, Node-RED provides an intuitive visual interface that allows users to easily build data processes by dragging and dropping nodes. Node-RED data visualization is based on Node-RED and uses various charts and display components to present data in a more intuitive and easier-to-understand visualization form. Zongheng Intelligent Control EG8000 device is an edge computing gateway equipped with Node-RED drag-and-drop design program.
The advantages of Node-RED data visualization are mainly reflected in the following aspects :
1. Visual programming , through the intuitive interface and dragging nodes, makes data processing and visual programming simpler and more efficient.
2. Diversified charts . Node-RED data visualization supports a variety of common data charts, such as line charts, pie charts, bar charts, etc., to meet various data display needs.
3. Real-time data update . By combining with real-time data sources, Node-RED data visualization can display real-time data updates and help users understand data changes in a timely manner.
4. Strong scalability . Node-RED data visualization supports access to various third-party data sources, such as databases, API interfaces, etc., and has strong scalability.

The application scenarios of Node-RED data visualization are also very wide, including but not limited to the following fields ,
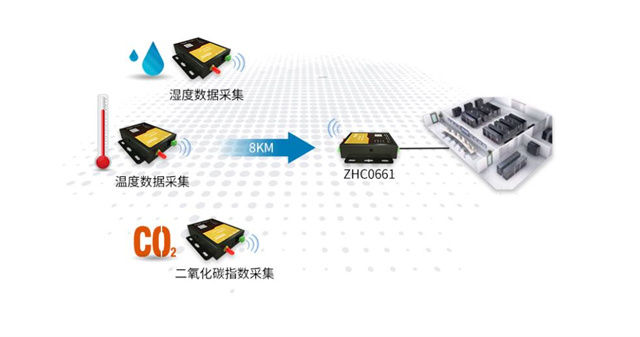
1. IoT device monitoring , Node-RED data visualization can help enterprises intuitively monitor the status and data of IoT devices, discover problems in a timely manner and deal with them.
2. Data analysis report . Through Node-RED data visualization, users can convert complex data analysis results into intuitive charts and displays to better report and display to superiors and partners.
3. Operation and business monitoring . For some scenarios that require real-time monitoring of business and operational data, Node-RED data visualization can help users clearly see data status and trends, and make timely adjustments and decisions.
To sum up, Node-RED data visualization, as a new data visualization tool, has simple and easy-to-use features and rich and diverse chart display methods, and is gradually being loved and widely used by users. For enterprises and developers, mastering the use of Node-RED data visualization will open a more intuitive and clear window for them in data analysis and business decision-making, helping them better understand and apply data.
